
Year 10: Parabolas and graph intersections
 Back to tutorials
In Australian Year 10 Mathematics, the parabola is often your first curved graph in coordinate geometry. You need to recognise its shape, sketch it from a simple equation, and understand how to find where it intersects with another graph.
Recognising the shape
The graph of is U-shaped and symmetric. If the coefficient of is positive, the graph opens upward. If it is negative, it opens downward.
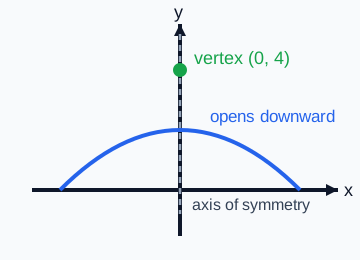
The sign in front of controls whether the parabola opens up or down, and the graph stays symmetric about its vertical centre line.
- The negative sign means the parabola opens downward.
- The moves the graph upward.
- The graph has its highest point above the origin.
Sketching with a table of values
A safe Year 10 method is to choose a few x-values, calculate the corresponding y-values, and plot them. Using values on both sides of the centre helps show the symmetry clearly.
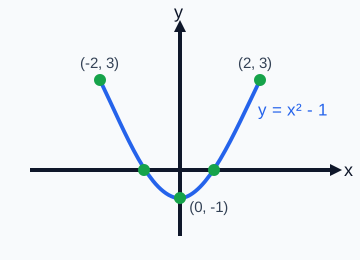
Plotting matching points on either side of the centre makes the symmetry visible and helps you draw the parabola as a smooth curve instead of disconnected segments.
- Substitute .
- The y-values are .
- Plot .
- Join them smoothly to form the parabola.
Intersection of two graphs
If two graphs intersect, their y-values are equal at the same x-value. Algebraically, this means you set the equations equal and solve.
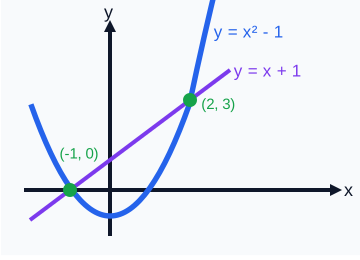
Intersections are the shared points where both rules produce the same coordinate, so the graph matches the algebraic equation you solve.
- Set the equations equal: .
- Rearrange: .
- Factor: .
- So or .
- Substitute into .
- If , then .
- If , then .
Link to inequalities
Once you can sketch lines and parabolas, you can reason about which region of the graph satisfies an inequality. That is why sketching and intersections support later work on systems of linear inequalities in Year 10.
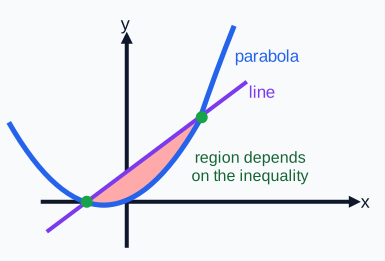
Inequality questions are about choosing the correct region of the plane, not just locating the boundary curves.
Common mistakes
- Plotting too few points to show the curved shape properly.
- Forgetting that a parabola is symmetric.
- Finding x-values for intersections but not calculating the matching y-values.
- Drawing straight line segments instead of a smooth curve.
Study routine
For a parabola, start with a small table of values. For intersections, set the equations equal, solve carefully, and then substitute back. A quick sketch after the algebra is a strong final check.