
Year 10: Linear intercepts
 Back to tutorials
In Australian Year 10 Mathematics, straight-line graphs are a major part of coordinate geometry. One of the fastest ways to understand a line is to find its intercepts. These are the points where the line crosses the axes, and they help you sketch the graph, check equations, and interpret linear models in context.
Why intercepts matter
Intercepts let you sketch a line quickly without needing a big table of values. In applications, they can also represent useful real-world meanings such as a starting value, a break-even point, or the moment a quantity becomes zero.
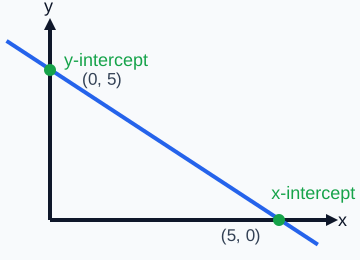
A straight line has two key axis crossings: its y-intercept on the vertical axis and its x-intercept on the horizontal axis.
Finding the y-intercept
The y-intercept is the point where the line crosses the y-axis. On the y-axis, the x-coordinate is always zero, so substitute into the equation.
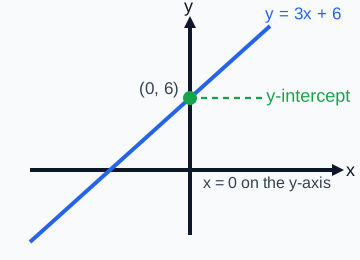
The y-intercept is found where the line meets the y-axis, so the x-value there must be .
- Set .
- .
- The y-intercept is .
Finding the x-intercept
The x-intercept is where the line crosses the x-axis. On the x-axis, the y-coordinate is zero, so substitute and solve for .
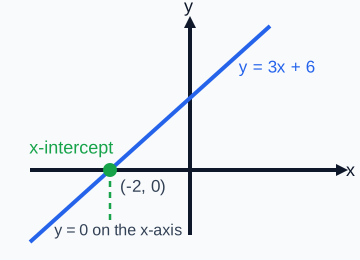
The x-intercept is found where the line meets the x-axis, so the y-value there must be .
- Set .
- .
- .
- .
- The x-intercept is .
Using intercepts to sketch a line
Once you know both intercepts, plot them and draw a straight line through them. This is a quick Year 10 sketching method.
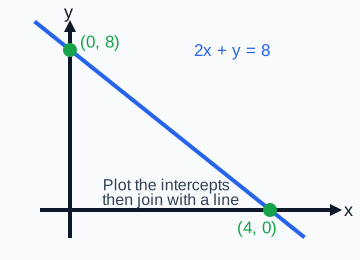
Once both intercepts are plotted, a single straight line through them gives the graph.
- Set : , so .
- The x-intercept is .
- Set : .
- The y-intercept is .
- Plot the two points and join them with a straight line.
Common mistakes
- Setting both and equal to zero at the same time.
- Writing only the number instead of the full intercept coordinate.
- Making a sign error when solving for the x-intercept.
- Assuming intercepts must always be positive.
Study routine
A reliable Year 10 routine is to find the x-intercept and y-intercept separately, then check whether the graph direction looks reasonable. If your line slopes up but your plotted points suggest it slopes down, recheck the algebra.